Animated Mandelbrot Orbits
Anyone who has done any computer-generated graphics has come in contact with the Mandelbrot set.

Named after Benoit Mandelbrot (but with a history stretching back much farther[a]), it was explored by Douady and Hubbard in their paper Exploring the Mandelbrot set - The Orsay Notes[b]. The set is defined as the set of points in the complex plane that do not escape to infinity when iterated by the function:
z_(n+1) = z_(n)^2+c
z_(0) = 0, c in CC
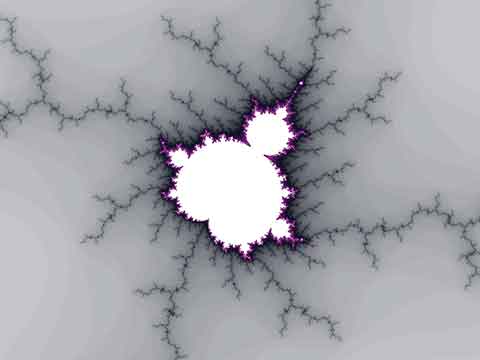
The set itself is perhaps not very interesting, but if we color the points outside of it based on how fast they escape toward infinity we get some nice pictures, like the following:
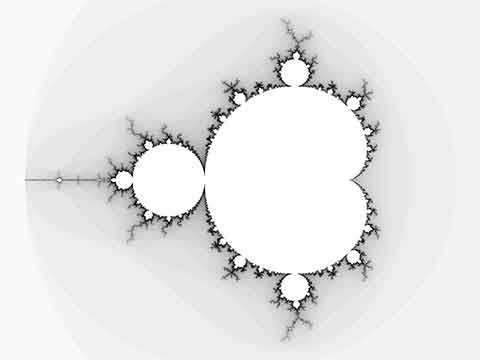
The Mandelbrot set is the flat white object, with outside points colored in various shades of gray - the darker, the longer it took for the point to escape.
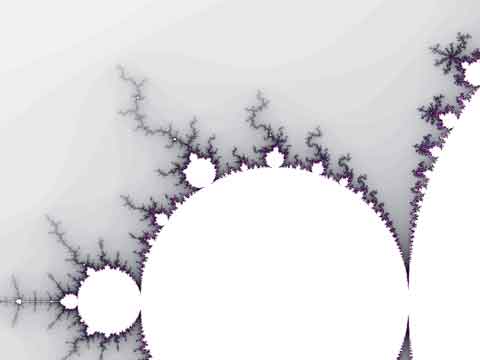
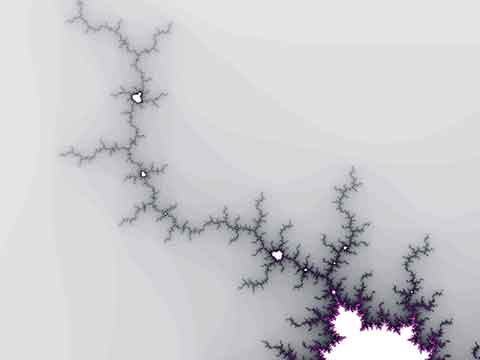
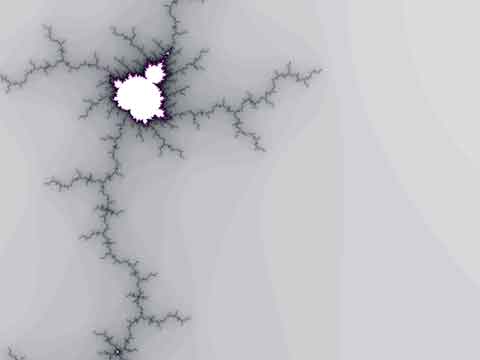
The interesting thing about the Mandelbrot set is that it is self-similar. Zoom in on the set, and tiny Mandelbrot islands appear:
The question I had, but had never gotten a satisfactory answer to, was this: What is the property of the Mandelbrot function that gives rise to the self-similarity?
All articles I'd read basically said "here's the function, look at how pretty the picture is, it's self-similar".
But why?
I'm not a mathematician, but this is what I think is the answer.
First, let's look at a Koch snowflake:
This curve is created by starting with three lines, and then replacing the middle third with two lines from an equilateral triangle. Then repeating the process for the four line segments you end up with, then repeating it for the next set of line segments. Let's look at the first three steps:
Here we have the initiator - the straight line; and the generator - the line with a triangle bump in the middle. We start with a line, and then we replace the line with a-line-with-a-bump. But now we have four lines, so we replace each one of them with a-line-with-a-bump. This gives us a curve with sixteen line segments. Replacing each one of those segments with the generator gives us the next curve in the series. The process is then allowed to go on into infinity and the line just becomes more and more zig-zaggy.
Here it's easy to see where the self-similarity comes from: It's right there in the process we use to create the line. "Take each line in the curve, and replace it with the whole curve." You can't not get self-similarity with such an instruction. But where is the same process in the generation of the Mandelbrot set?
Turns out it is in the iteration.
Each iteration z_(n+1) = z_(n)^2+c folds the complex plane over itself, essentially taking the bottom half of the complex plane and twisting it up over the top half, and the top half over the bottom half. If we start with a grid of evenly spaced points in the complex plane, and perform an interpolation of their positions so that we see how they move from their starting position to the end position in the iteration, this repeated folding becomes obvious.
Press play to see how the points c in CC move as they are iterated. The number in the lower left indicates the number of iterations performed.
It may be difficult to see at first, but this is the "fold":